
Growing up in India, I was always struck by Amul's billboards. They had this unique way of combining humor and current events that I haven't seen anywhere else. Have you noticed them too?


For broader context: Amul Butter, a popular Indian brand, is renowned for its witty advertising campaigns that cleverly incorporate current events and trending topics. These ads, displayed on prominent billboards throughout India, have become a cultural phenomenon, offering a humorous take on the world's happenings.
The key here is Amul would create these hoardings based on the LATEST trending topics across the world! This has almost been a national obsession because Amul has been known the come up with a comical representation of what is happening in the world.
Imagine having access to data that reveals exactly what captures your customers' attention in different cities and regions.
As a marketer or brand analyst, this information would be invaluable. You could leverage it to:
- Tailor marketing campaigns to resonate with local interests.
- Identify emerging trends and capitalize on them early.
- Optimize ad spending by targeting areas with high interest in relevant topics.
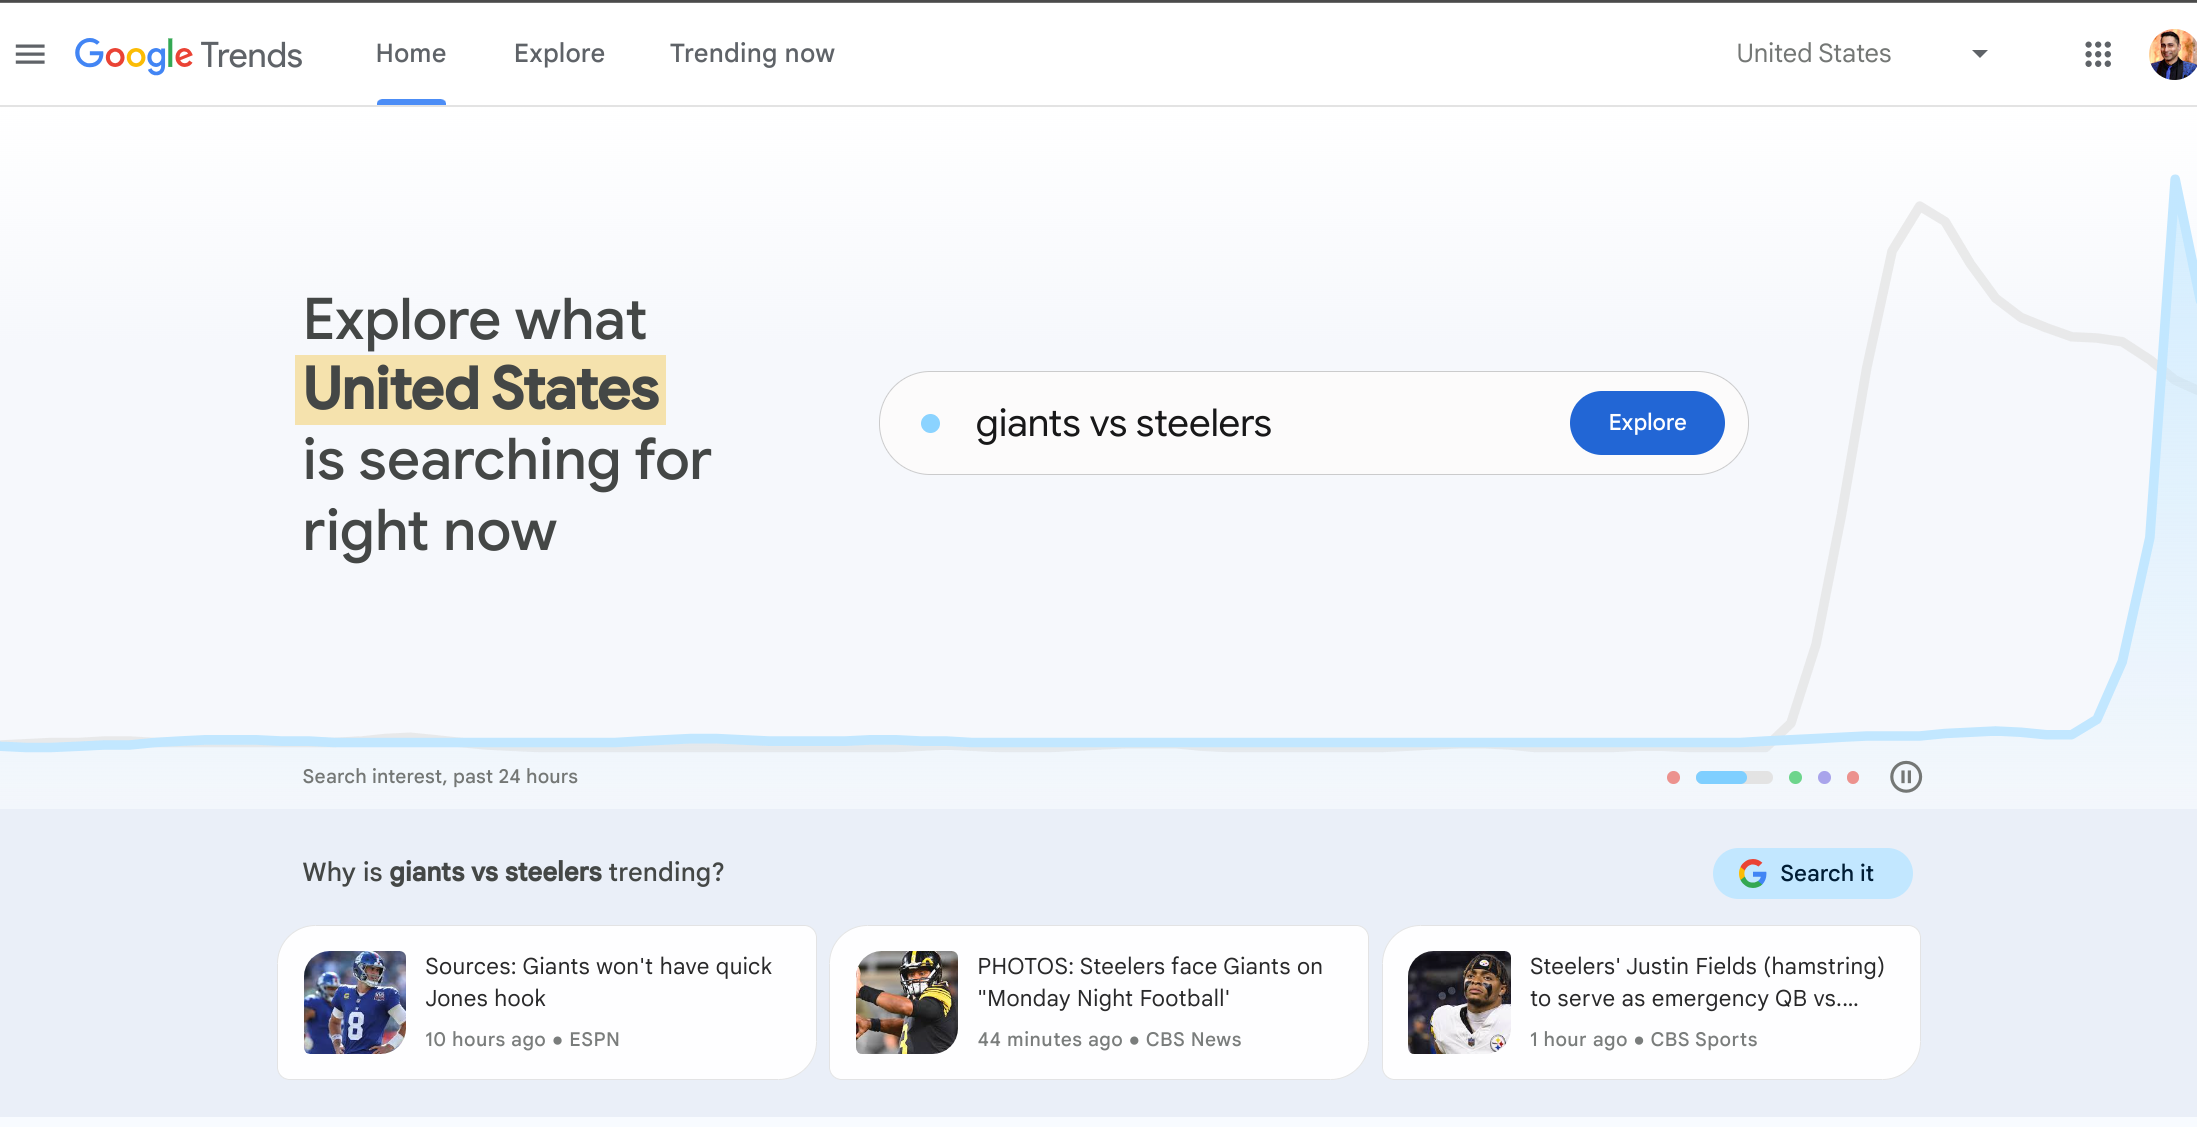
Did you know google provides you access to those Trends via Google Trends - https://trends.google.com/trends/
But did you also know That is Google Trends data available as part of the BigQuery Public Datasets Program!
What is Google Trends Dataset ?
The Google Trends dataset will provide critical signals that individual users and businesses alike can leverage to make better data-driven decisions. This dataset simplifies the manual interaction with the existing Google Trends UI by automating and exposing anonymized, aggregated, and indexed search data in BigQuery.
This dataset includes the Top 25 stories and Top 25 Rising queries from Google Trends. It will be made available as two separate BigQuery tables, with a set of new top terms appended daily. Each set of Top 25 and Top 25 rising expires after 30 days, and will be accompanied by a rolling five-year window of historical data in 210 distinct locations in the United States.
As you know, I like to provide hands-on information about these topics. So, here's the schema of the dataset that's available in my BigQuery instance (it'd be available in yours too).

And here is the preview of the table values

If I'm a national retailer with multiple stores, how can I use this dataset to boost my marketing efficiency? And if I'm a retail media network, how can I make my audience data more insightful when it comes to location?
Let's say I've got a BigQuery table filled with data on my physical store locations. I can use the DMA table to identify the DMA for each store. Then, by joining this with the trends data using the DMA ID, I can narrow in on the top three search terms for each store's area within the past week, based on the terms with the highest scores.

Understanding the Data
Our analysis centers around a BigQuery table containing Google Trends data, that has following interesting variables:
- term: STRING (e.g., "electric scooter for kids", "best adult scooter")
- dma_name: STRING (e.g., "New York", "Los Angeles")
- week: DATE (first day of the week)
- score: INTEGER (popularity index, 0-100)
We assume the retailer also possesses a table with their store locations, including latitude and longitude, which can be geocoded to determine the corresponding DMA for each store.
Part 1: Optimizing Retail Marketing with Hyperlocal Insights
For a national retailer with numerous stores, understanding local search trends is crucial. By joining the Google Trends data with the store location data, we can identify the top trending search terms for each store's DMA. This allows for highly targeted marketing campaigns.
Example Query 1: Identifying Top Trending Terms per Store DMA (Last Week)
WITH StoreDMAs AS (
  SELECT
    store_id,
    dma_name
  FROM
    `your_project.your_dataset.store_locations`
),
TopWeeklyTrends AS (
  SELECT
    dma_name,
    term,
    MAX(score) as max_score,
    ROW_NUMBER() OVER (PARTITION BY dma_name ORDER BY score DESC) as rn
  FROM
    `bigquery-public-data.google_trends.top_terms`
  WHERE week BETWEEN DATE_SUB(CURRENT_DATE(), INTERVAL 7 DAY) AND CURRENT_DATE()
  GROUP BY dma_name, term
)
SELECT
    s.store_id,
    s.dma_name,
    t.term,
    t.max_score
FROM
    StoreDMAs s
JOIN
    TopWeeklyTrends t ON s.dma_name = t.dma_name
WHERE t.rn <= 3
ORDER BY s.store_id, t.max_score DESC;
This query identifies the top search terms in each store's DMA within the last week. The retailer can then:
- Tailor advertising: If a DMA shows high interest in "electric scooters for kids," the retailer can focus ads in that area on children's scooter models and highlight features like safety and fun.
- Adjust inventory: Increased searches for "off-road scooters" in a specific region might signal a need for more off-road models in those stores.
- Targeted promotions: Run localized promotions based on trending terms. For example, offer discounts on "foldable scooters" in areas with high search volume for this term.
Part 2: Enhancing Retail Media Network (RMN) Audience Data with Localized Insights
For RMNs, understanding localized consumer interests provides an edge. This allows for more effective audience segmentation and targeted ad placement.
Example Query 2: Identifying Rising Search Terms for Electric Scooters Across DMAs
WITH RisingTrends AS (
  SELECT
    dma_name,
    term,
    AVG(score) OVER (PARTITION BY dma_name, term ORDER BY week ASC ROWS BETWEEN 13 PRECEDING AND CURRENT ROW) as avg_score,
    AVG(score) OVER (PARTITION BY dma_name, term ORDER BY week ASC ROWS BETWEEN 25 PRECEDING AND 13 PRECEDING) as prev_avg_score,
    (AVG(score) OVER (PARTITION BY dma_name, term ORDER BY week ASC ROWS BETWEEN 13 PRECEDING AND CURRENT ROW) - AVG(score) OVER (PARTITION BY dma_name, term ORDER BY week ASC ROWS BETWEEN 25 PRECEDING AND 13 PRECEDING)) as score_diff
  FROM
    `bigquery-public-data.google_trends.top_terms`
  WHERE term LIKE '%electric scooter%'
)
SELECT
    dma_name,
    term,
    avg_score,
    prev_avg_score,
    score_diff
FROM
    RisingTrends
WHERE score_diff > 10  -- Identify terms with a significant increase in average score
ORDER BY score_diff DESC;
This query identifies terms related to electric scooters that have shown a significant increase in average search score over a four-week period, providing insights into emerging trends in each DMA. This empowers RMNs to:
- Refine audience targeting: Target ads showing "off-road electric scooters" to DMAs exhibiting a rise in searches for this specific term.
- Optimize ad placement: Prioritize ad placements in DMAs with high interest in relevant terms.
- Improve ad relevance: Craft ads that resonate with the localized trends discovered.
By merging Google Trends data with a retailer's internal data, hyperlocal marketing campaigns can be crafted with surgical precision. Efficiency and effectiveness skyrocket as a result.
Here's the kicker: the trending terms might not be a perfect match for your products. That's where the fun begins! Use embeddings and large language models to find the search trend term that's closest to your product content. Then, let Gemini or another LLM craft tailored messaging around it. Gen AI can help you scale this up, so you're not stuck with non-matching items.
This detailed approach, illustrated through these examples, allows retailers and RMNs to achieve a deeper understanding of consumer preferences at a granular level. The result? Higher ROI and stronger customer engagement. The key is to tailor analysis and queries to the specific needs of the business, constantly monitoring trends to adapt strategies accordingly.
Hope this was insightful!