
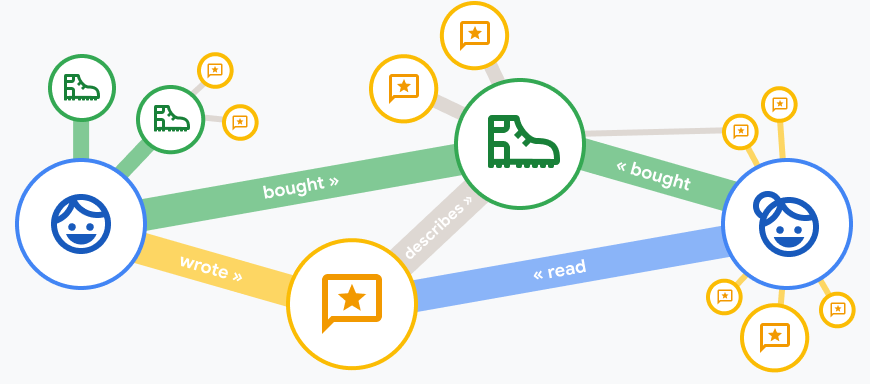
Google Cloud just released Spanner Graph and it’s AWESOME news for Marketers and Retail Media Networks
Let me explain this from the context of a Retail Media Network. I will present my POV from a Marketers perspective in a future article
Unleashing the Power of Graph Techniques for Retail Media Monetization
Within the dynamic landscape of retail media, where creating interesting insights about your audience is of utmost importance, Spanner Graph stands out as a revolutionary tool. Leveraging advanced graph technology, it ingeniously transforms raw e-commerce data into actionable insights, unlocking the potential for highly impactful audience monetization strategies.
Wait, what is Spanner Graph ??
Spanner Graph unites purpose-built graph database capabilities with Spanner, which offers industry-leading scalability, availability, and consistency. Spanner Graph supports a graph query interface compatible with the ISO GQL (Graph Query Language) standards. Spanner Graph supports interoperability between relational and graph models and combines the well-established SQL capabilities with the expressiveness of graph pattern matching from GQL.
Spanner Graph's ability to model complex relationships between customers, products, and sellers as a connected network allows it to go beyond traditional data analysis. It reveals hidden patterns and connections that are invaluable for retail media networks. By understanding how customers interact with products, who influences their decisions, and what their preferences are, you can tailor your advertising strategies with laser precision.
Cool, so now that we know a bit more about Spanner Graph, lets understand how Spanner Graph leverages graph techniques to extract those golden nuggets of insight:
- Community Detection: Uncover groups of customers with shared interests or buying behaviors. This enables you to create highly targeted ad campaigns and personalized product recommendations, significantly increasing engagement and conversion rates.
- Centrality Measures: Identify influential customers or products within the network. These are the trendsetters and popular items that can be leveraged for influencer marketing campaigns or premium ad placements.
- Path Analysis: Trace customer journeys through the graph to understand how they discover and interact with products. This informs product placement strategies and helps optimize the customer experience, ultimately leading to more sales.
- Recommendation Engines: Build powerful recommendation systems based on graph connections. Suggest products that are not only relevant to individual customers but also likely to resonate with their social circles, amplifying the impact of your retail media campaigns.
Alright, as you know, i like to keep things Real.
So i am creating an ecommerce schema from scratch and will insert data into it and would like to highlight what additional insights can be generated.
Step 1: Creating a hypothetical Ecommerce Schema on Spanner DB that i can use to create a graph on.
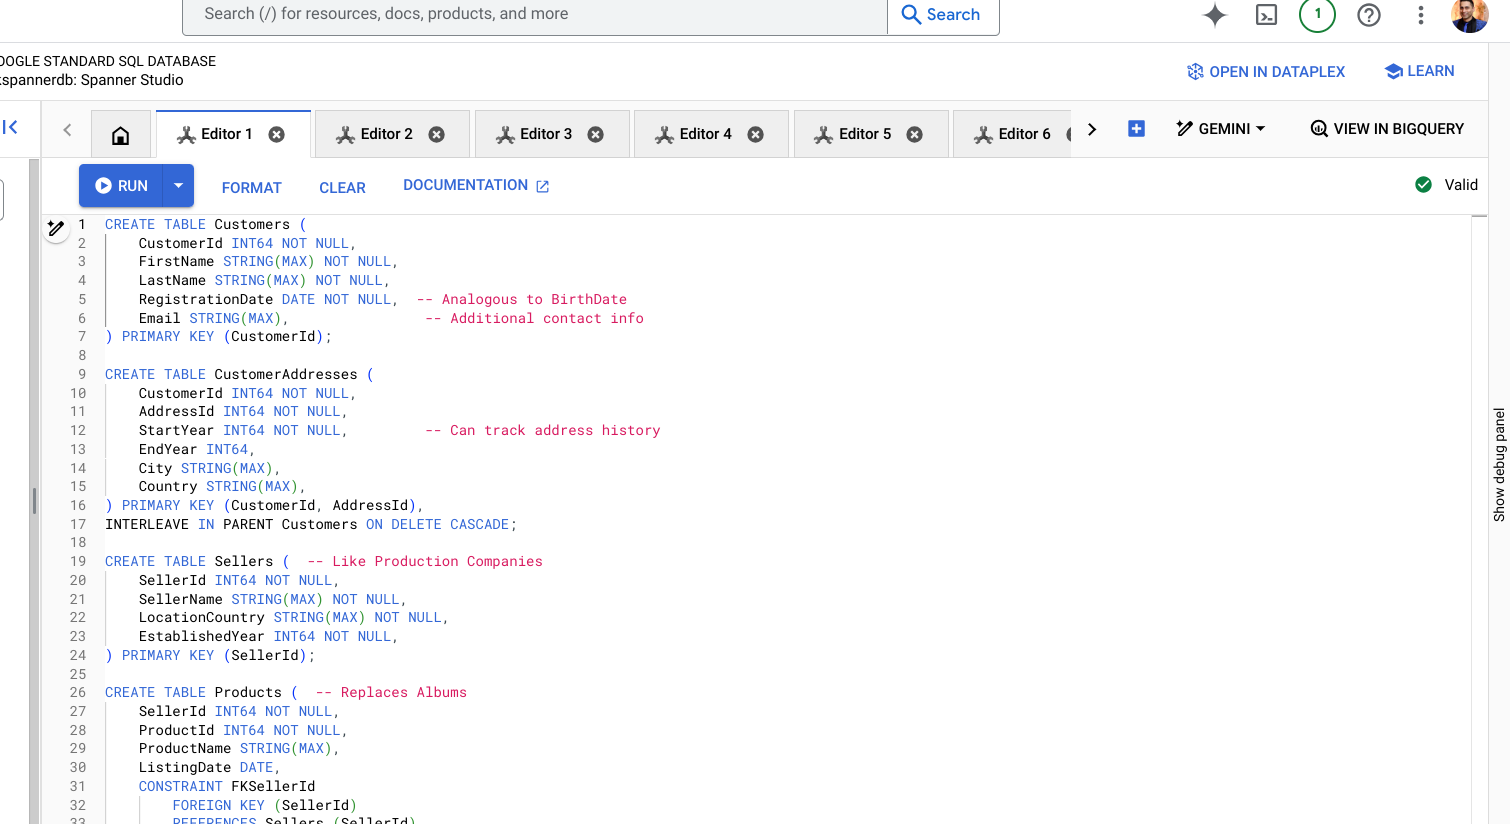
Once the schema is set up, we'll populate it with data for the e-commerce platform. This might include:
- Customer details (name, email, demographics)
- Product specifics (name, description, category, price)
- Seller information (name, location, ratings)
- Order history (customer, product, seller, date, quantity)
- Social connections (friendships, followers)
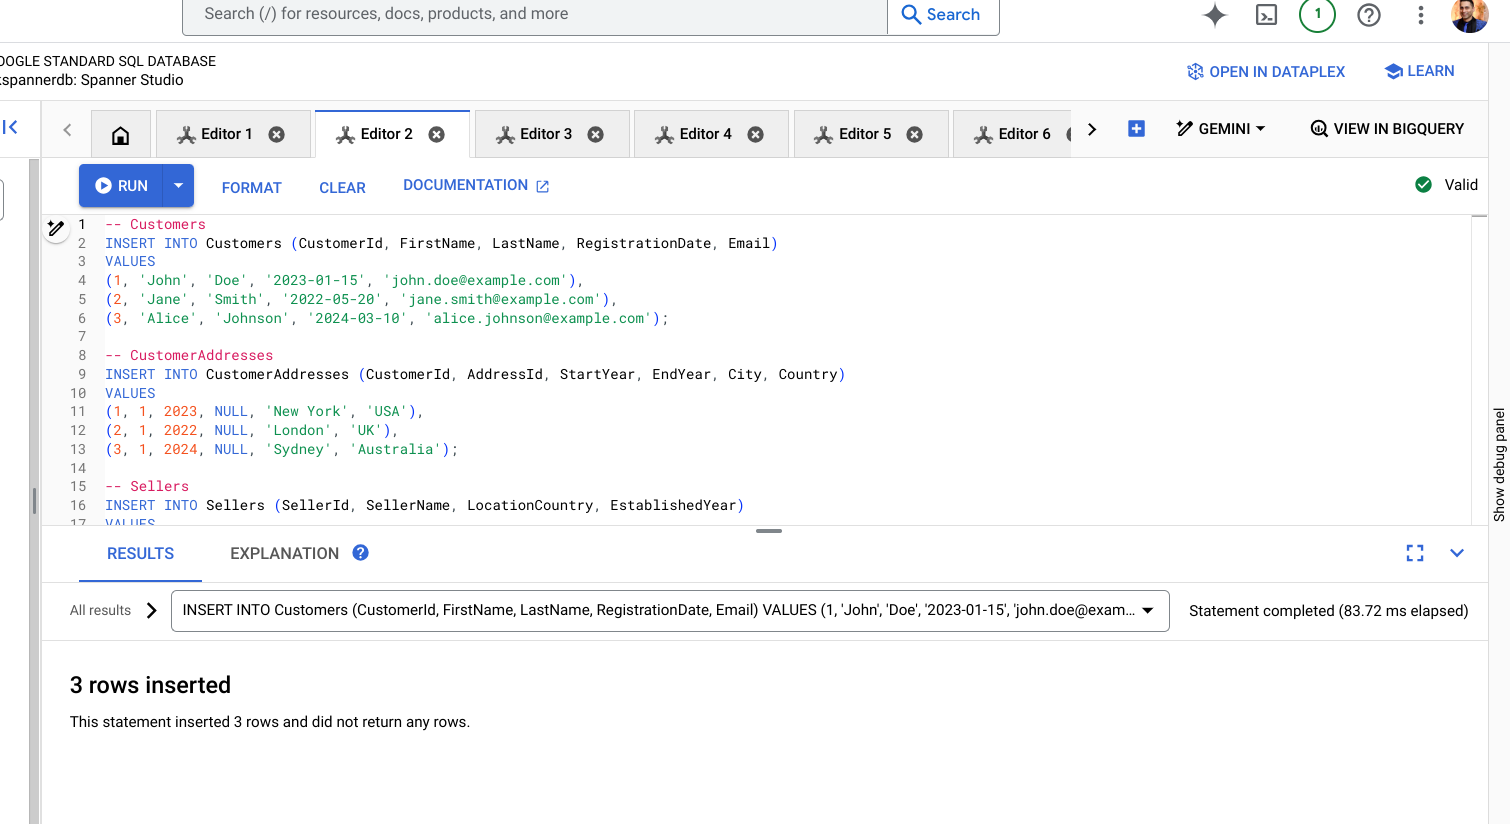
With the data loaded, we transform the relational schema into a Spanner Graph:
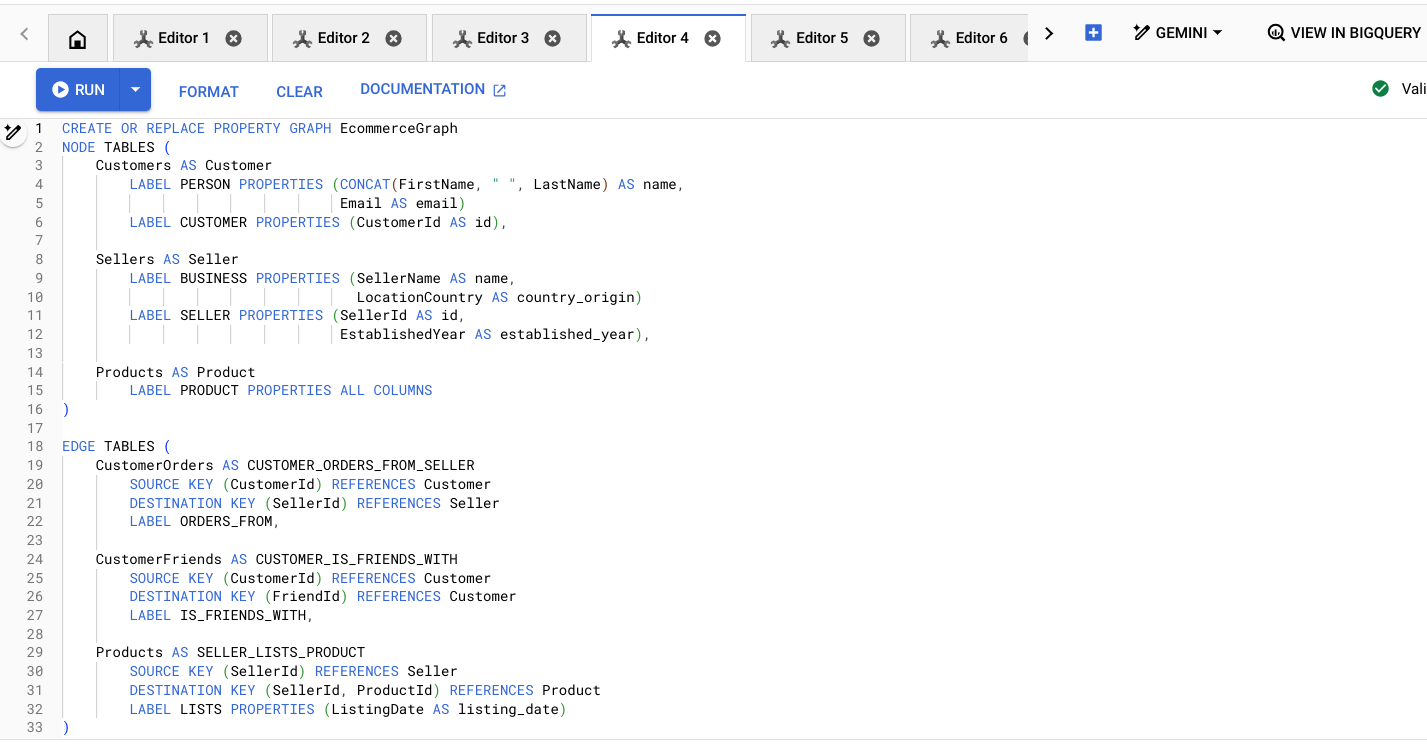
This process maps tables to nodes, extracts relevant properties, and establishes edges based on the relationships defined in your schema.
- Node Labels: We assign labels like PERSON, CUSTOMER, BUSINESS, SELLER, and PRODUCT to categorize nodes.
- Edge Labels: We define relationships like ORDERS_FROM, IS_FRIENDS_WITH, and LISTS to connect nodes.
- Properties: We extract relevant attributes from the relational tables as properties on the nodes and edges.
Here is how a basic structure of spanner graph looks like
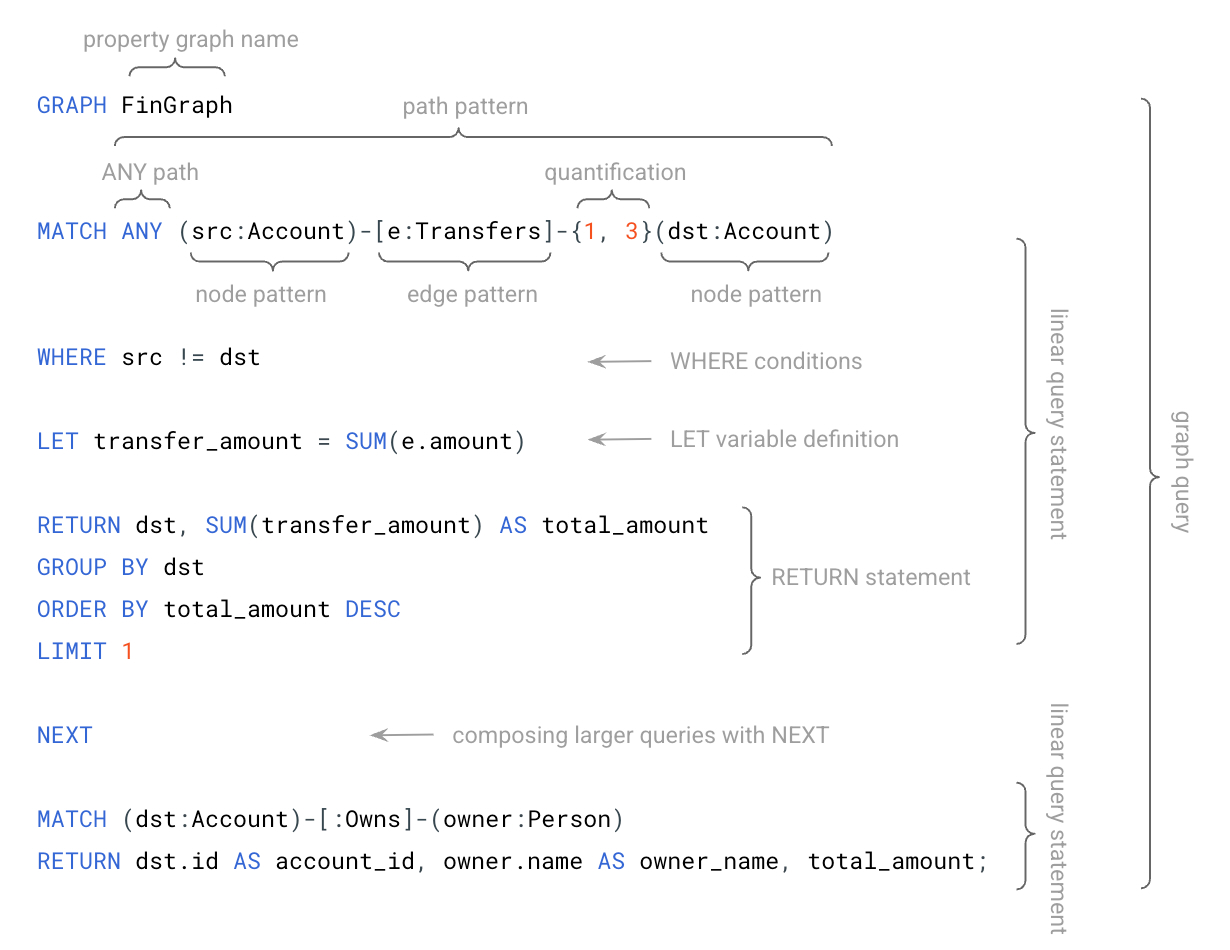
Spanner Graph lets you create multiple graphs inside a database. The query starts by specifying the target graph, FinGraph, using the GRAPH clause.
Querying the Graph: Uncovering Insights
Let's explore a few example queries and their business implications:
Example 1: Finding a Customer's Friends and Their Preferred Sellers
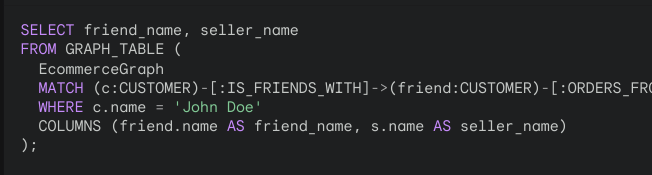
Business Context: This query helps identify potential influencers or brand advocates among a customer's social circle. It can be used to tailor recommendations or target marketing campaigns.
Example 2: Discovering Products Listed by a Seller
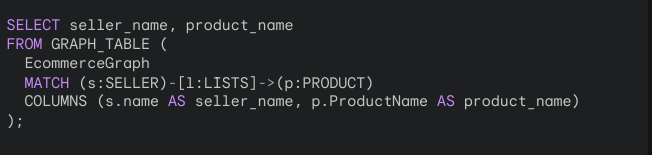
This query provides a quick overview of a seller's product catalog, which can be useful for inventory management or competitor analysis.
Now that you have understood the above scenarios, let me expand on this a little bit
Imagine a vast e-commerce platform with:
- Customers (Nodes): Representing individual shoppers.
- Products (Nodes): Representing the items available for purchase.
- Orders (Nodes): Representing transactions.
- Views (Edges): Connecting customers to products they've viewed.
- Purchases (Edges): Connecting customers to products they've bought.
- Categories (Nodes): Representing product groupings (e.g., Electronics, Clothing).
- Belongs To (Edges): Connecting products to their categories.
- Also Viewed (Edges): Connecting products frequently viewed together.
- Also Bought (Edges): Connecting products frequently purchased together.
Benefits of Spanner Graph and Graph Pattern Matching
1. Real-Time Product Recommendations
- Challenge: Providing personalized product suggestions as customers browse.
- Solution:
- Graph Pattern: (customer)-[:Views]->(product1)-[:Also_Viewed]->(product2)
- Explanation: Finds products (product2) frequently viewed together with products (product1) the customer has recently viewed.
- Benefit: Enables real-time recommendations, boosting cross-selling and upselling opportunities.
2. Personalized Category Suggestions
- Challenge: Suggesting relevant categories to customers based on their purchase history.
- Solution:
- Graph Pattern: (customer)-[:Purchases]->(product)-[:Belongs_To]->(category)
- Explanation: Identifies categories (category) containing products the customer has previously bought.
- Benefit: Tailors the browsing experience, making it easier for customers to find what they want.
- Customer Segmentation
- Challenge: Grouping customers based on similar browsing and buying patterns.
- Solution:
- Graph Pattern: Complex patterns involving multiple hops to identify customers who view and purchase similar types of products or belong to the same communities.
- Benefit: Enables targeted marketing campaigns and personalized experiences.
With Spanner Graph, you can transform your e-commerce platform into a retail media powerhouse, generating new revenue streams while delighting your customers.
Remember, the key is to keep exploring and experimenting. By harnessing the power of Spanner graph , you can stay ahead of the curve and unlock the full potential of retail media in the ever-evolving world of e-commerce.